Colon Cancer Illustration |
|
|
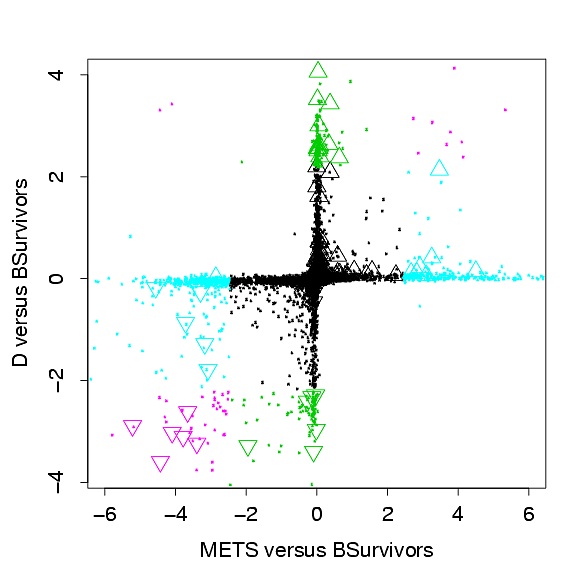
Figure 1 BAMarray colon cancer analysis involving 4 disease stages: Duke's stage B tumors (all survivors), Duke's stage C tumors, Duke's stage D tumors and METS (site of distant metastasis was the liver). See Ishwaran and Rao (2005a) for further details. Vertical and horizontal axes in Figure 1 are estimated differential effects between stage D's versus BSurvivors and METS versus BSurvivors. Genes differentially expressing for both groups (magenta); D's but not METS (green); METS but not D's (blue); none (black). Also indicated are expressed C versus BSurvivors genes ( Early "hit-and-run" genes hug the vertical axis.
|
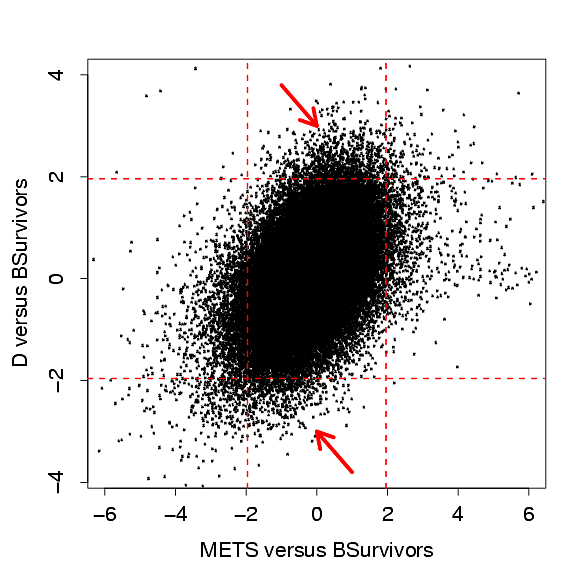
Figure 2 Standard ANOVA estimates from same colon cancer data. Arrows indicate quadrants containing potential hit-and-run genes using 95% confidence regions. Observe how difficult it is to identify such genes because of excess noise |